

Our Strategy and Rational in the Current Environment
Over the years,Warren Buffett has compared the financial markets to a cathedral that has an attached casino. The idea is that the cathedral is quiet, solemn and represents how patience and discipline can construct durable and long-lasting wealth. By contrast, the casino is high energy, emotional, and money changes hands very quickly. People are free to move back and forth between the cathedral and the casino. During periods of market excitement and hype, more people move to the casino to gamble and speculate. The investors who remain in the cathedral can see the party happening next door and it can feel awfully lonely. However, it is so important during these times to remain committed to the long-term goal. Often, these periods represent opportunities for diligent, long-term investors and staying the course has prevented the deep, lasting long-term losses that have followed prior speculative frenzies.
We saw this play out during the Dot Com Era of the late 1990s. Investors that focused on quality investments and long-term horizons were largely out of favor as speculative trades on new technology companies drove the market. In December of 1999, Barron’s published a piece titled “What’s Wrong, Warren?” During that year, Berkshire Hathaway declined by about 20% while the S&P 500 rose by more than 20% and the Nasdaq rose by more than 85%. Warren Buffett and Charlie Munger famously refrained from investing in the high-flying technology stocks. They remained in the cathedral while the casino printed easy money for tech investors. The authors of the Barron’s article suggested that Mr. Buffett and Mr. Munger had lost their investing touch as the “New Economy” had arrived and was being driven by new technologies. The irony of the story is the timing. The Dot Com market peaked only three months after that Barron’s publication. Over the decade that followed this story, investors in the S&P 500 lost 9% and Nasdaq investors lost 40% of their 1999 starting capital. Berkshire Hathaway grew 79%.
This story came to mind as we watched a May 2026 interview with Mr. Buffett. In the interview, he said that we “have never had people in a more gambling mood than now.” We certainly see a lot of similarities with today’s market and casino-like markets of the past. In this letter, we detail some of these dynamics. Despite the caution that the current market environment warrants, we continue to see opportunities in stocks away from the euphoric AI (and data center) trade. We remain mostly invested in equities, but we have directed capital away from the companies we believe are most exposed to the speculative hype. Our portfolio construction and active management approach seeks to manage downside risk associated with certain market segments while emphasizing investments in companies we believe to be high quality and economically resilient.
The Casino and Current Market Dynamics
When the market closed on May 15th, the S&P 500 had gained 14.4% over a trailing 50-day window. This 50-day upward move was in the top 0.5% of all rolling 50-day market moves going back 75 years and was dominated by just a handful of stocks. We see many casino-like traits of this current market and we introduce a few below.
Market Concentration: The top 10 companies of the US stock market have reached a concentration weight not seen since the 1930s. At the end of April, the top 10 stocks in the S&P 500 made up about 40% of the total index. Eight of these ten companies are technology stocks that trade at extremely high valuations relative to their recent earnings. The average P/E ratio of these top 10 stocks is over 60.
Market Valuation: The S&P 500 Index is trading at valuation levels that we have not seen since the late 1990s. One of our favorite valuation metrics is the CAPE ratio – or a P/E ratio that adjusts for economic cycles. At the end of April, the CAPE on the S&P 500 was 40.9. The last time the CAPE was over 40 was the Dot Com Era. In one hundred years of data, the S&P 500 has never posted a positive subsequent 10-year period after starting with a CAPE ratio at or above 40. The Absher Wealth Management Core portfolio had a CAPE around 26 at the end of April. This is 35% cheaper than the index and has historically been associated with more positive outcomes.
Investors Chasing Risk: The stocks that have been driving the market over the last 12 months are the most volatile subset in the market. These are the stocks with the bounciest price moves (up and down) and are typically the stocks with the greatest amount of uncertainty. Much like a casino game, this type of price behavior allows for the highest potential of quick gains (and big losses) for investors that trade over short windows. These stocks have outperformed the steadiest, low volatility subset of stocks in the S&P 500 by 75% over the trailing 1-year window.
Quick Payoffs: Zero-Day Options are instruments that allow a trader to make a bet on what the index will do in one single day. If their bet is wrong, the option expires worthless. If it is right, the payoff can be very large. These options are a lot like gambling and have little legitimate investment purpose other than pure speculation. Currently, more than 60% of all index option activity on the S&P 500 expires same day. According to Barclay’s research, zero-day options made up less than 10% of activity in 2018. This tells us that much of the daily activity and volatility is attached to traders making very short-term bets rather than fundamental, long-term decisions.
Semiconductor Frenzy: Semiconductor stocks dominated headlines in April of 2026. Micron shares rose 60% during the month and Intel, after 26 years, finally regained its prior all-time peak from the Dot Com Era. The market’s parabolic path in the semiconductor space is eerily similar to the semi cycle of the late 1990s. Figure 2 in the Appendix plots the current trajectory of the semiconductor index today versus the path of the same index during the Dot Com Bubble. We have been very selective in our semiconductor exposure in the portfolio with this history in mind.
The Cathedral and Focusing on the Long-Term
In Mr. Buffett’s analogy, the cathedral is home to patient investors aiming to compound wealth over long horizons. We borrow much of our investment philosophy from famous investors throughout history who have practiced and stuck to this approach: Warren Buffett, Charlie Munger, Benjamin Graham, Peter Lynch, Sir John Templeton. Our primary goal is to allocate capital to businesses that are consistently profitable with strong balance sheets, that grow organically and can generate high internal returns on reinvested capital, and that are run by management teams who have their interests aligned with long-term shareholders. A byproduct of this approach is that our portfolio holds what we believe to be extremely high-quality businesses, that are economically resilient and trade at reasonable prices relative to their economic fundamentals.
By design, our portfolio looks very different than the broader index right now. As we watch the market grow increasingly short-sighted and speculative in nature, we have been positioning our portfolios with an eye towards what may lie ahead. We are being cautious and prudent with our portfolio management decisions but still see opportunities in the market away from today’s popular AI trade. This was the case in prior casino-like markets as well. Figure 3 provides statistics showing that the stocks that were most left out of the rally during 1997-1999 actually made money during the early 2000s even as the previously high-flying stocks collapsed. The lowest quartile of stocks from 1997-1999 turned out to be the best performers over the full 13-year period from 1997-2010 and outperformed the high-flying stocks of the Dot Com era by more than 100% over the ten-year period from 2000-2010.
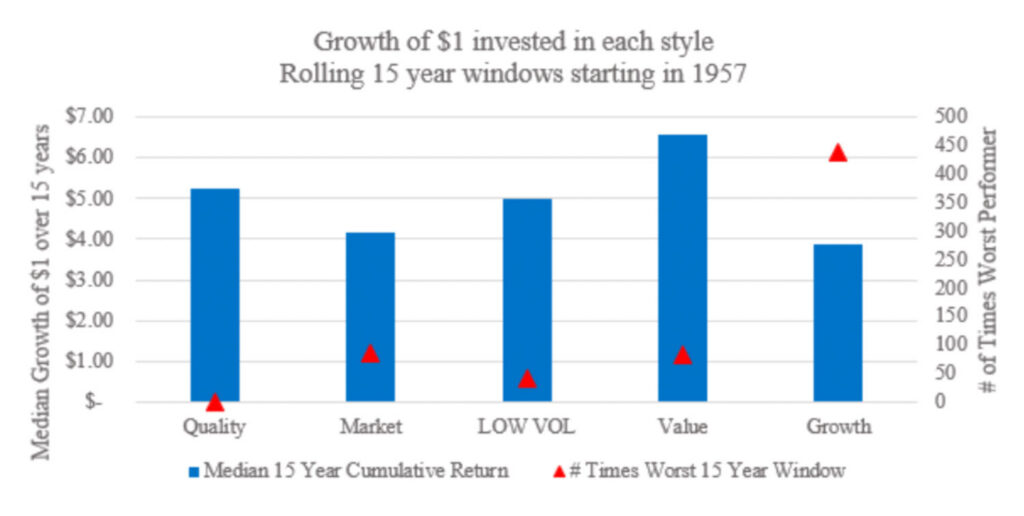
For a long-term investor that depends on their capital to sustain their retirement lifestyle through withdrawals, avoiding catastrophic outcomes and massive volatility is often far more important than missing the best return over a short window. Our portfolio approach is designed with this in mind to give our clients’ portfolios the best chance of long-term success. Leaning on more than 65 years of data, we believe that investing in quality businesses, steady businesses, and reasonably valued businesses yields the best long-term outcomes. Additionally, these styles have had the lowest probability of catastrophic long-term portfolio events. In the data that we examined, portfolios that chased the growthiest, most exciting stocks ended as the worst performing investment style over rolling 15-year windows more than two thirds of the time. Portfolios that focused on quality businesses never had the worst 15-year outcome. Figures 4 and 5 summarize our statistical findings.
Much like Mr. Buffett and Mr. Munger held firm to their philosophy in 1999 amid the Dot Com frenzy, we will remain disciplined in adhering to our investment approach now. Given what we know about market history and the underlying statistics for the long run, we like our current seat in the cathedral much better than the casino.
Figures and Graphics
Figure 1: CAPE Ratio and Forward 10-Year Returns
The graph below plots 10 year returns (vertical axis) against starting CAPE levels (horizontal axis). As the CAPE increases to the right, annualized 10 year returns decline. There has never been a positive 10-year return following a CAPE over 40.
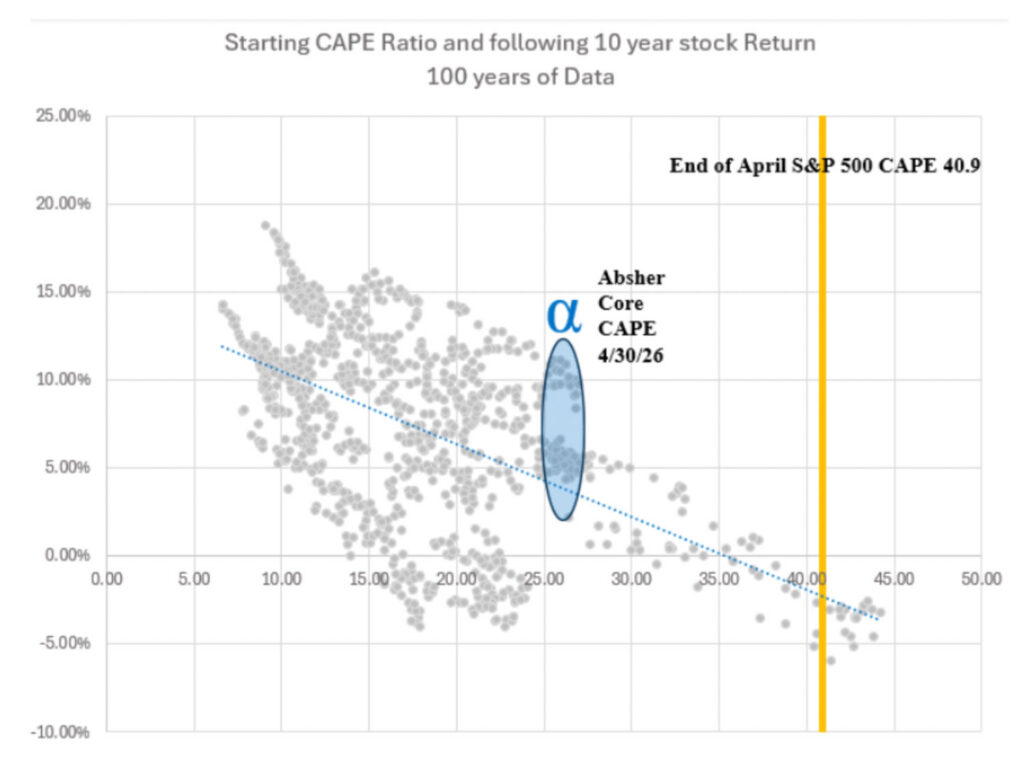
Figure 2: Philadelphia Semiconductor Index (SOX)
The graph below plots the cumulative returns to the SOX index from two separate starting points. The grey line starts with the Netscape IPO in 1995 as the start of the Dot Com frenzy. The blue line is the current trajectory starting with the ChatGPT release marking the start of the AI trade. Based on these starting points, the current trajectory has been faster than the Tech Bubble. However, notice that over the 150-month window in the picture, the SOX index roundtrips back to the Netscape IPO level despite tremendous returns in the late 1990s.
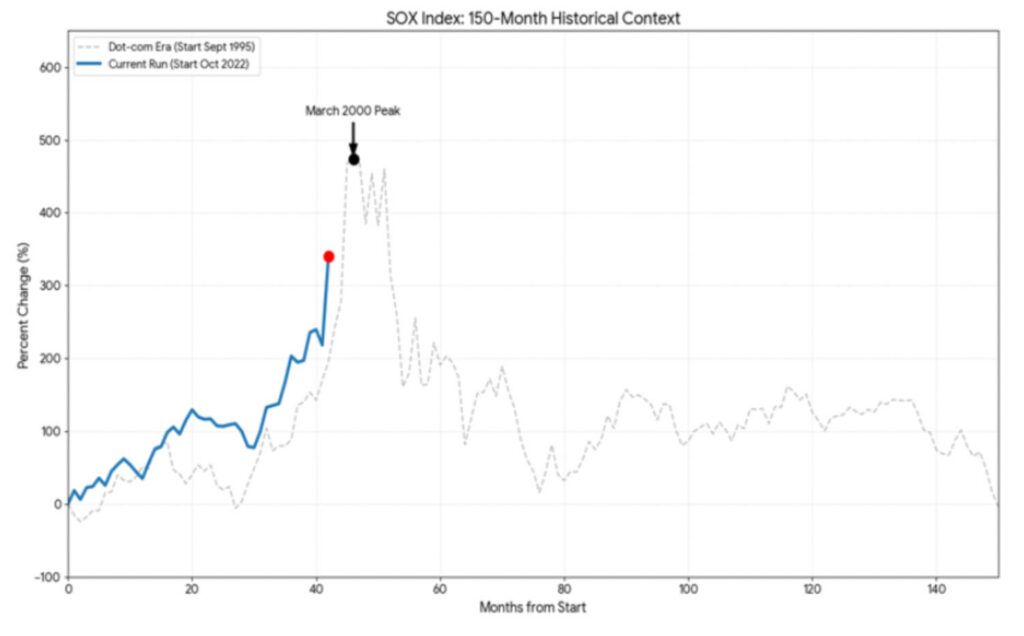
Figure 3: Winning in the Short-Term vs Winning in the Long-Term
The following table shows returns to four different groups of stocks divided by their Beta at the end of 1999. The lowest quartile stocks would have been the stocks with the lowest correlation to the Dot Com trade in the late 1990s. In other words, these were the “forgotten” stocks or even the Dot Com “losers.” The highest quartile stocks would be the stocks with the highest correlation to the indices, or the stocks most related to the Dot Com winners of the late 1990s. The table shows that as the Dot Com winners collapsed in the early 2000s, the stocks that were left out of the euphoria in the late 1990s actually made money. These stocks turned into the best performing stocks over the 10-year period from 2000-2010 and were the best performing group of stocks for the entire 1997-2010 period despite significantly lagging during the first three years.
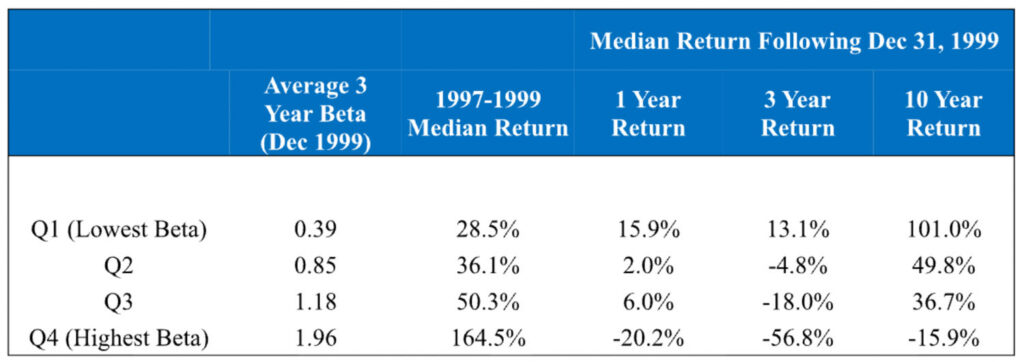
Figure 4: Slow and Steady Wins the Race
The picture below shows the growth of $1 invested in two separate portfolios over the last 75 years. The blue line shows a portfolio that invests in a strategy to identify the lowest volatility (steadiest) stocks. The red line shows a portfolio that invests in the highest volatility stocks (growth, exciting). Over the last 75 years, a dollar invested in the low volatility portfolio would have grown to be about 5x larger than a dollar invested in the high volatility portfolio.
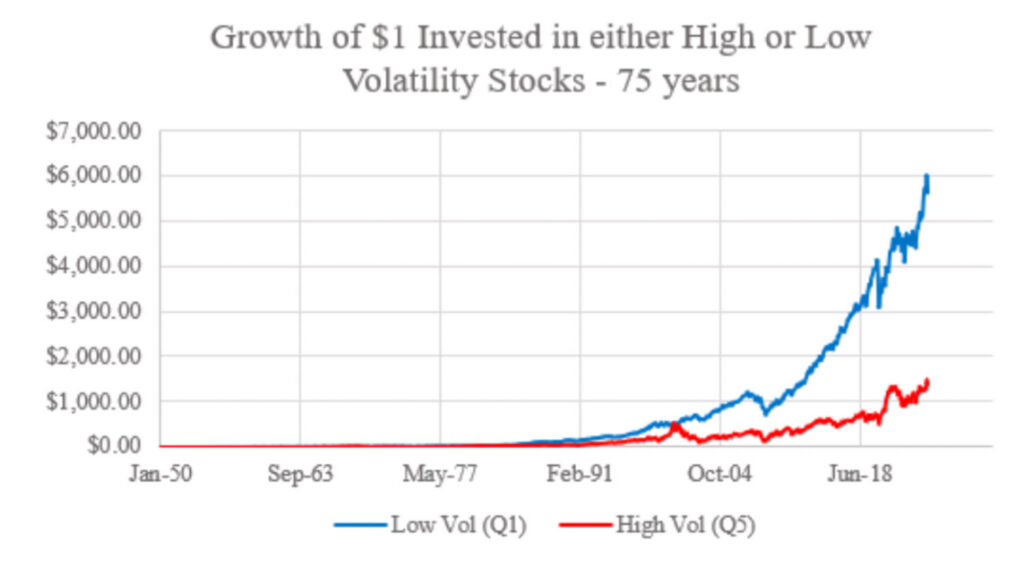
Figure 5: Long Term Outcomes of Different Investing Styles
The blue bars in the picture below shows the median growth of $1 over rolling 15-year windows for various investment styles. The red triangles show how many times each style was the worst performer over those same 15-year rolling windows. Quality, Low Volatility, and Value had the highest median outcomes and lowest frequency of being the worst. Growth portfolios that chased the high flying stocks of the day had the lowest median outcome and were the worst performers two-thirds of the time.
Important Disclosures: This commentary was originally prepared for clients of Absher Wealth Management and is being shared for information and educational purposes only and should not be construed as personalized investment advice or a recommendation to buy or sell any security. The views expressed herein are those of Absher Wealth Management as of the date of publication and are subject to change without notice. Past performance does not guarantee future results. All investments involve risk, including the possible loss of principal. References to historical market events, valuation measures, investment styles, and statistical relationships are intended for illustrative purposes only and should not be relied upon as predictions of future market performance. Investment strategies discussed may not be suitable for all investors. Absher Wealth Management, LLC is an investment adviser registered with the U.S. Securities and Exchange Commission. Registration does not imply a certain level of skill or training. Additional information regarding Absher Wealth Management, LLC, including its investment advisory services, is available in its Form ADV Part 2 and Form CRS, which are available upon request.